Why Your LLM API Is Slow (And What Actually Fixes It)
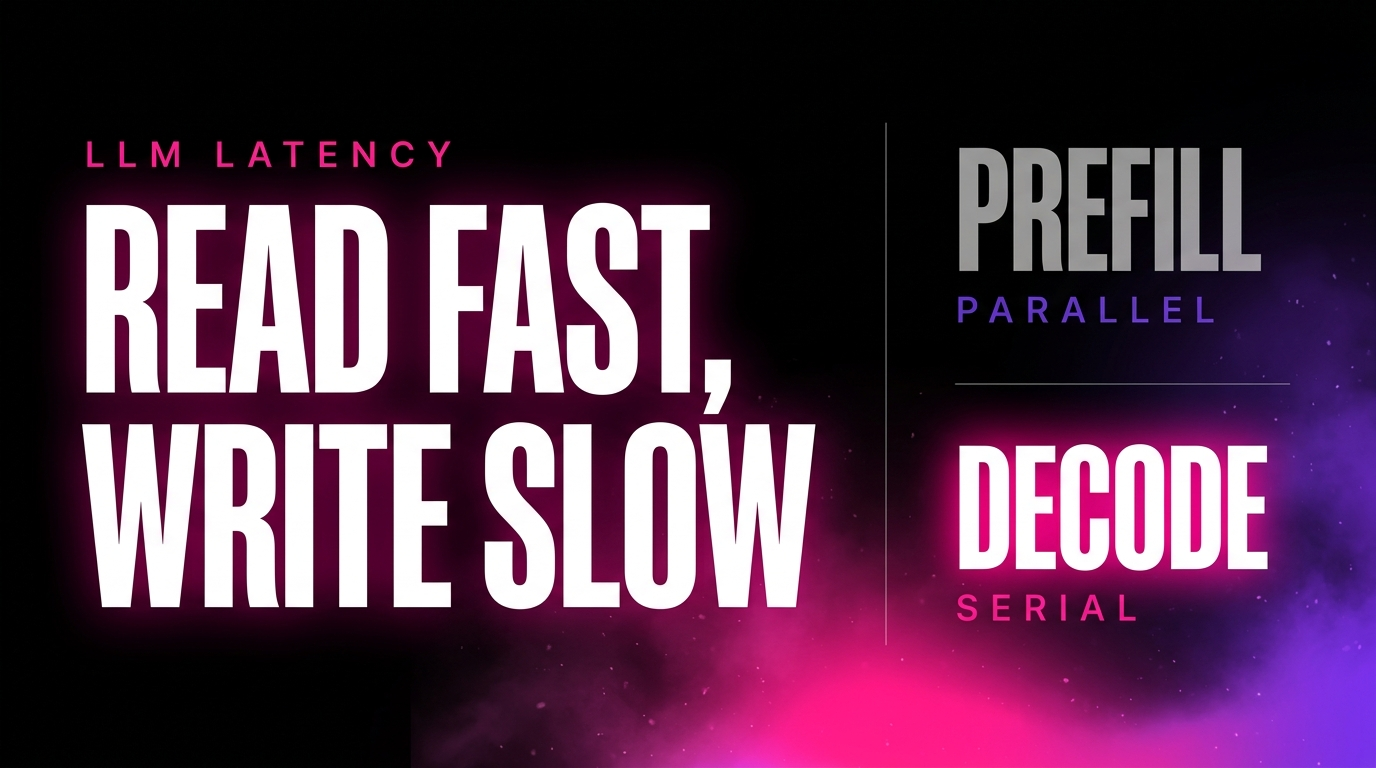
LLM latency is driven almost entirely by how much text the model writes, not how much it reads. A model processes your entire prompt in one parallel pass, then generates the response one token at a time, each one waiting on the last. That asymmetry means a single output token costs hundreds of times more wall clock time than a single input token, so the fastest way to speed up almost any request is to make the answer shorter, not the prompt.
This guide explains the mechanic, shows you how to tell which half of it is hurting you, and covers the levers that actually work for each case.
The two phases behind every request
Every LLM request runs in two distinct stages with completely different performance characteristics. Almost every latency mistake comes from not knowing which one you are fighting.
Prefill. The model reads your entire prompt at once. Because the whole input is known upfront, it processes all those tokens in parallel, in one heavy burst of matrix multiplication, and builds the internal key and value cache it will need for generation. This is compute intensive but highly parallel, so it scales well with input length. Prefill is what you are waiting through before the first word appears.
Decode. The model generates the response one token at a time. Each token depends on the one before it, so this stage cannot be parallelized within a single request. It is a sequential loop, bounded largely by memory bandwidth rather than raw compute, and it repeats once per output token.
That structural difference is the whole story. Reading is parallel. Writing is serial. And it is also why every provider charges more for output tokens than input tokens: the pricing mirrors the compute, because generating a token genuinely costs more than reading one.
The three numbers, and which one your users feel
Time to first token, TTFT. How long until the first word appears. This is prefill latency, plus network overhead.
Inter token latency, ITL, sometimes called time per output token. How fast tokens arrive after the first one. This is decode speed, and it determines whether streamed output feels smooth or stuttery.
Total completion time. Everything, start to finish.
Most teams optimize total completion time because it is the number in their logs. Users experience something different. In a streaming interface, a user feels TTFT as responsiveness and ITL as fluency, and may not consciously notice total time at all. In a non streaming call, they feel the whole wait as one block. Which number you should be optimizing depends on your interface, and it is worth deciding that on purpose.
The diagnostic: your input to output ratio
The same ratio that determines your bill also determines your latency. Sum the input and output tokens on a representative sample of your traffic and compare.
If your prompts are long and your answers short, you are prefill weighted, and TTFT is where your delay lives. Retrieval augmented workloads, document analysis, and long context extraction all land here.
If your prompts are short and your answers long, you are decode weighted, and output length is essentially your entire latency budget. Content generation, long form writing, and code generation land here.
The shortcut version: if it feels slow before the first word appears, that is prefill. If it crawls once tokens start arriving, that is decode.
Why output length dominates almost everything
Here is the asymmetry made concrete. The figures below are illustrative, using a mid range assumption of roughly 100 output tokens per second and prefill running at roughly 30 milliseconds per 1,000 input tokens. Your real numbers depend on the model, the provider, and current load, but the shape holds everywhere.
Under those assumptions, one output token costs about 300 times more wall clock time than one input token.
| Workload shape | Tokens | Time to first token | Total | Output’s share |
|---|---|---|---|---|
| Long prompt, short answer | 10,000 in, 200 out | 300 ms | 2.3 s | 87% |
| RAG or extraction | 5,000 in, 300 out | 150 ms | 3.1 s | 95% |
| Chat turn | 1,000 in, 800 out | 30 ms | 8.0 s | 99% |
| Long form generation | 500 in, 2,000 out | 15 ms | 20.0 s | 99% |
| Huge context, short answer | 150,000 in, 500 out | 4,500 ms | 9.5 s | 53% |
Look at the first two rows against the fourth. A request reading 10,000 tokens and writing 200 finishes in a fraction of the time of one reading 500 and writing 2,000, despite processing far more total text.
This is the single most useful thing to internalize about LLM performance, because it inverts the common instinct. People blame long prompts for slow responses. Long prompts are cheap in time. Long answers are expensive.
The last row is the exception that proves it. Once you are at very long context, prefill finally becomes a real share of the total, and only then does trimming the input meaningfully help.
The levers that work, by shape
If you are decode bound, which is most workloads
Cap max_tokens deliberately. The most direct latency control you have. Set it to what the task actually needs rather than to a comfortable ceiling.
Ask for less. Prompt for a concise answer, a specific format, or a fixed number of items. An instruction that reliably halves output length halves your latency, and it cuts cost at the same time because output is the expensive side of the meter too.
Use stop sequences. If your output has a natural terminator, stop there rather than letting the model continue.
Consider a faster model. For high volume, low judgment tasks where quality has already saturated, a smaller model is usually faster as well as cheaper.
Check your reasoning settings. On models with configurable reasoning effort, the reasoning tokens are generated before the answer, so they add directly to your latency and are billed at output rates. On tasks that do not need deliberation, turning effort down is a latency and a cost win at once.
If you are prefill bound, meaning long context
Prompt caching. This is the big one, and it is specifically a prefill lever. A cache hit skips recomputing the cached prefix, so it cuts TTFT substantially on long prompts. On a genuinely long context request it can remove most of the wait before the first token.
Send less context. Retrieve the relevant chunks instead of dumping the whole corpus. This helps quality too, since models do not attend evenly across a very long context.
Reorder for cacheability. Static content first, dynamic content last, so the stable prefix can actually be cached. This is the same rule that governs caching for cost.
The lever that is not what you think
Prompt caching is widely recommended as a general speed fix. It is not. Run it against the shapes above under the same assumptions.
On a long form generation request, 500 tokens in and 2,000 out, caching the prefix improves total time by a fraction of a percent, because prefill was never the problem. On a 150,000 token context request, the same caching improves total time by over 40%.
Same lever, same implementation, wildly different payoff. Which is why the diagnostic comes first: caching is a cost lever nearly always, and a latency lever only when you are prefill bound.
Streaming changes what users feel, not what you spend
Streaming does not make a request faster. It changes when the user starts seeing progress, which for interactive interfaces is most of the perceived speed.
A non streaming call that takes eight seconds feels like eight seconds of nothing. The same call streamed feels like it started almost immediately and then read at a comfortable pace. Total time is identical.
So stream anything a human is watching. And for anything a human is not watching, the opposite applies: batch it, take the discount, and stop paying attention to latency you do not need.
Why your latency moves when your code did not
One more thing worth knowing, because it explains a lot of confusing production behavior. Prefill and decode compete for the same hardware, and providers batch many customers’ requests together to keep utilization high. When a large prefill job lands in the same batch, it can briefly stall the decode loop of requests already streaming.
The visible symptom is a stream that pauses mid sentence and then resumes. Nothing is wrong with your code. You are sharing infrastructure, and someone else sent a very long prompt.
The consequence for how you should measure: latency on a shared API is a distribution, not a number. Track your p95 and p99, not the average, because the tail is where your users actually feel it, and the average will look fine while a meaningful slice of requests are slow.
It also means the fastest model for your task is not a fixed answer. It depends on current load, and current load changes hourly.
Where routing fits
That last point is the one you cannot fix in your own code. A hardcoded model cannot notice that it has become the slow option this afternoon.
Routing can. If your requests can reach several models through one interface, latency becomes a signal you can act on: send the request to a model that is responding quickly right now, rather than to the one that was the right choice when someone wrote the string months ago. Failover covers the harder version of the same problem, when a provider stops responding altogether.
This is also why measuring across providers is worth doing at all. Reaching several models normally means several integrations, which is why most teams never benchmark latency in production and simply live with whatever their default does.
MixRoute puts every major model behind one OpenAI compatible endpoint with automatic failover and zero markup, and smart routing weighs latency alongside quality and cost when picking the model for a request. Start building on MixRoute
FAQ
Why is my LLM API slow? Usually because your responses are long. A model reads your prompt in one parallel pass but writes the answer one token at a time, so output length drives total latency far more than prompt length. If the delay happens before the first word appears, that is prompt processing. If it happens while tokens are arriving, that is generation speed, and the fix is a shorter answer or a faster model.
What is time to first token? The delay between sending a request and receiving the first token of the response. It reflects how long the model took to process your prompt, plus network overhead. It is the number users feel most directly in a streaming interface, and it grows with prompt length.
Does a longer prompt make the response slower? Much less than people expect. Prompt tokens are processed in parallel, so they add to time to first token but relatively little to total time. Output tokens are generated sequentially and cost far more wall clock time each. Only at very long contexts does prompt length become a major share of total latency.
Does prompt caching make requests faster? It reduces time to first token by skipping recomputation of the cached prefix, so it helps significantly when you are sending very long prompts. It does nothing for generation speed, so on workloads with short prompts and long answers the improvement to total time is negligible. Caching is reliably a cost lever and only situationally a latency lever.
How do I reduce LLM latency? Start by finding whether you are limited by prompt processing or generation. If generation, cap max_tokens, prompt for shorter answers, use stop sequences, lower reasoning effort where it is not needed, and consider a smaller model. If prompt processing, use prompt caching, send less context, and order your prompt so the stable part comes first. Stream anything a person is watching.
Why does my latency vary so much for the same request? Because you share infrastructure with other customers. Providers batch requests together, and a large prompt from another request can briefly stall generation for requests already in flight. Track your 95th and 99th percentile latency rather than the average, since the tail is what users notice.
The bottom line
Reading is parallel, writing is serial. That one asymmetry explains most of what you experience as LLM slowness, and it means output length is your primary latency control on nearly every workload.
Find your input to output ratio before you optimize anything, because it tells you which half of the request is costing you. Cap your output and stream what humans watch. Cache and trim context when your prompts are genuinely long. And measure the tail rather than the average, because on shared infrastructure the average hides the requests your users complain about.
MixRoute gives you every major model behind one OpenAI compatible endpoint with automatic failover and zero markup, so the fastest model for a task is something you can measure and route to rather than guess at once and hardcode. Start building on MixRoute