LLM API Observability: Metrics, Traces, and Alerts That Matter
To distinguish provider, gateway, model, and application failures in an LLM stack, a team must instrument latency, errors, tokens, spend, routing decisions, and trace context with clearly defined denominators. Without a shared definition of what is being measured per request, per token, or per route, the same incident can be attributed to the wrong layer. This article defines the four failure domains, the core metrics and their denominators, and how traces connect them into a dashboard that isolates root causes without ambiguity.
The Four Failure Domains: Provider, Gateway, Model, Application
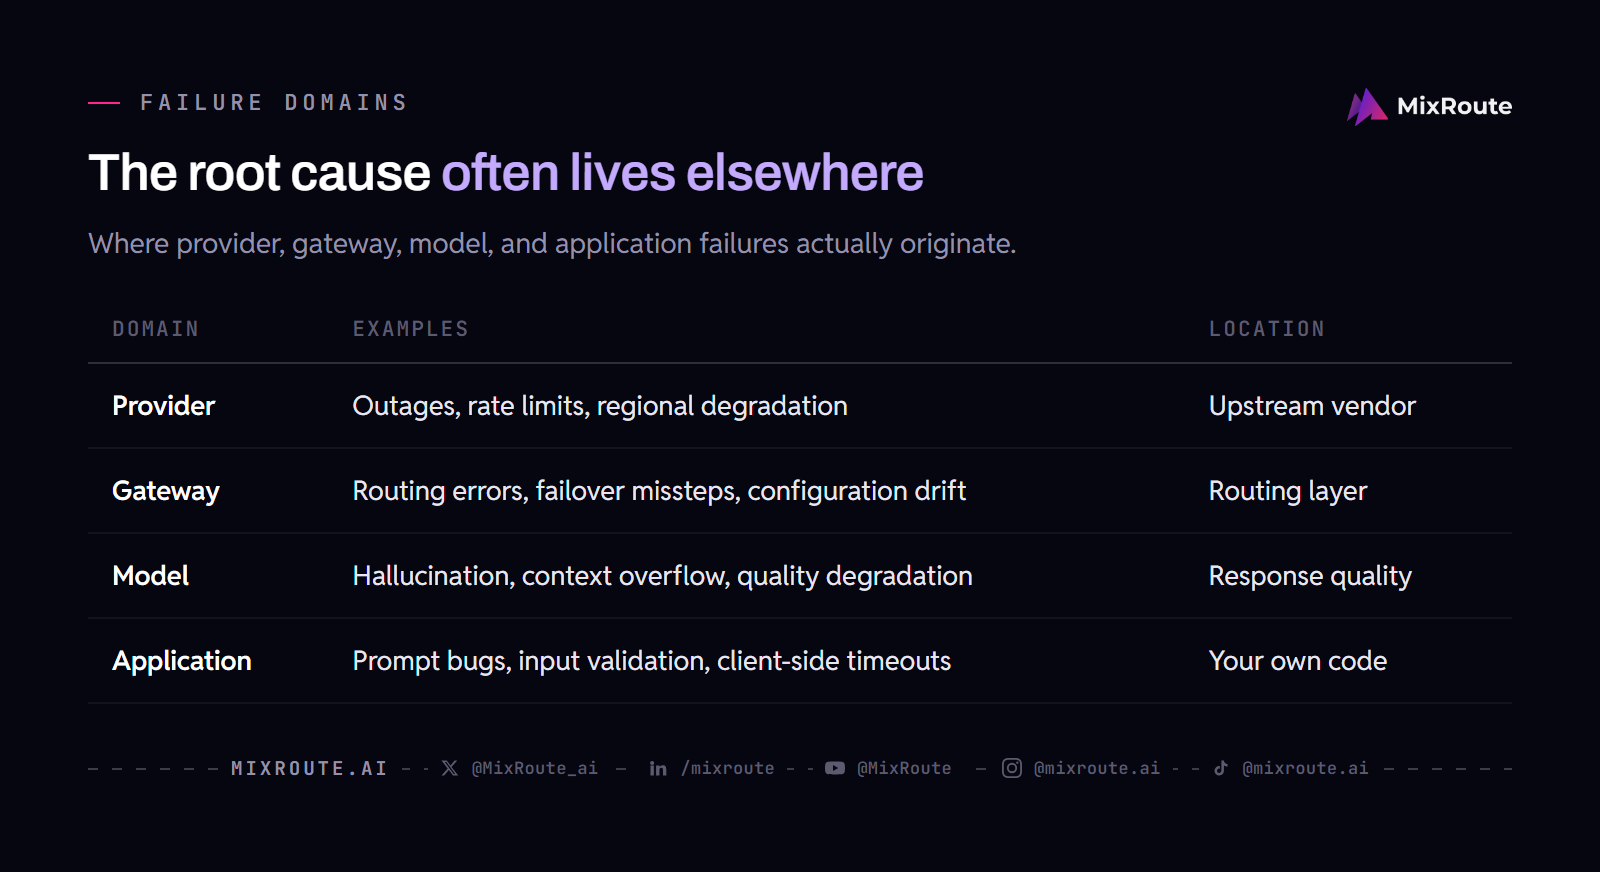
Failures in an LLM-powered system can originate in four distinct layers: the model provider, the gateway, the model itself, or the application that calls it, and observability must separate these domains to avoid misdiagnosis.
When a request fails or a response is slow, the first instinct is to blame the model. But the root cause often lives elsewhere. A provider outage, a gateway routing misconfiguration, a model context overflow, or an application-side timeout all present differently. The goal of observability is to make those differences visible.
Provider failures: outages, rate limits, regional issues
Provider failures originate with the vendor that hosts the model. Common examples include an API outage, a rate limit reached, or a regional degradation that affects a specific endpoint. These failures are external to your stack, but they are not always random. Some providers have documented uptime SLAs, and some do not. Monitoring provider-specific error codes and response times is how you confirm whether the problem is upstream.
Gateway failures: routing errors, failover missteps, configuration drift
Gateway failures are internal to the routing layer. If you use a hosted gateway like MixRoute, the gateway is responsible for sending your request to the right provider. A routing error, a failover misstep, or a configuration drift can cause requests to fail even when every provider is healthy. These failures are often intermittent and hard to reproduce, which makes trace context essential for diagnosis.
Model failures: hallucination, context overflow, quality degradation
Model failures are about output quality and constraints, not availability. A model can return a plausible but wrong answer or degrade in quality after a provider updates the underlying weights. Neither shows up as an HTTP error, so they require evaluation of the response content, which means you need to log outputs or sample them for review. Context overflow is the partial exception. Anthropic’s context window documentation, checked on 2026-08-25, states that when the input alone exceeds the window “the API returns a 400 invalid_request_error” on every model, so that case does reach your error-rate panel. The same page states that on its newer models an input that fits but whose max_tokens does not is accepted, and generation stops with a stop reason instead, so that case does not appear in your error rate at all.
Application failures: prompt bugs, input validation, client-side timeouts
Application failures are the ones you write yourself. A prompt that is malformed, input validation that rejects a valid request, or a client-side timeout that is too short can all cause symptoms that look like provider or model issues. The application layer is where you have the most control, and also where you are most likely to introduce bugs during a deploy.
Core Metrics: Latency, Errors, Tokens, Spend
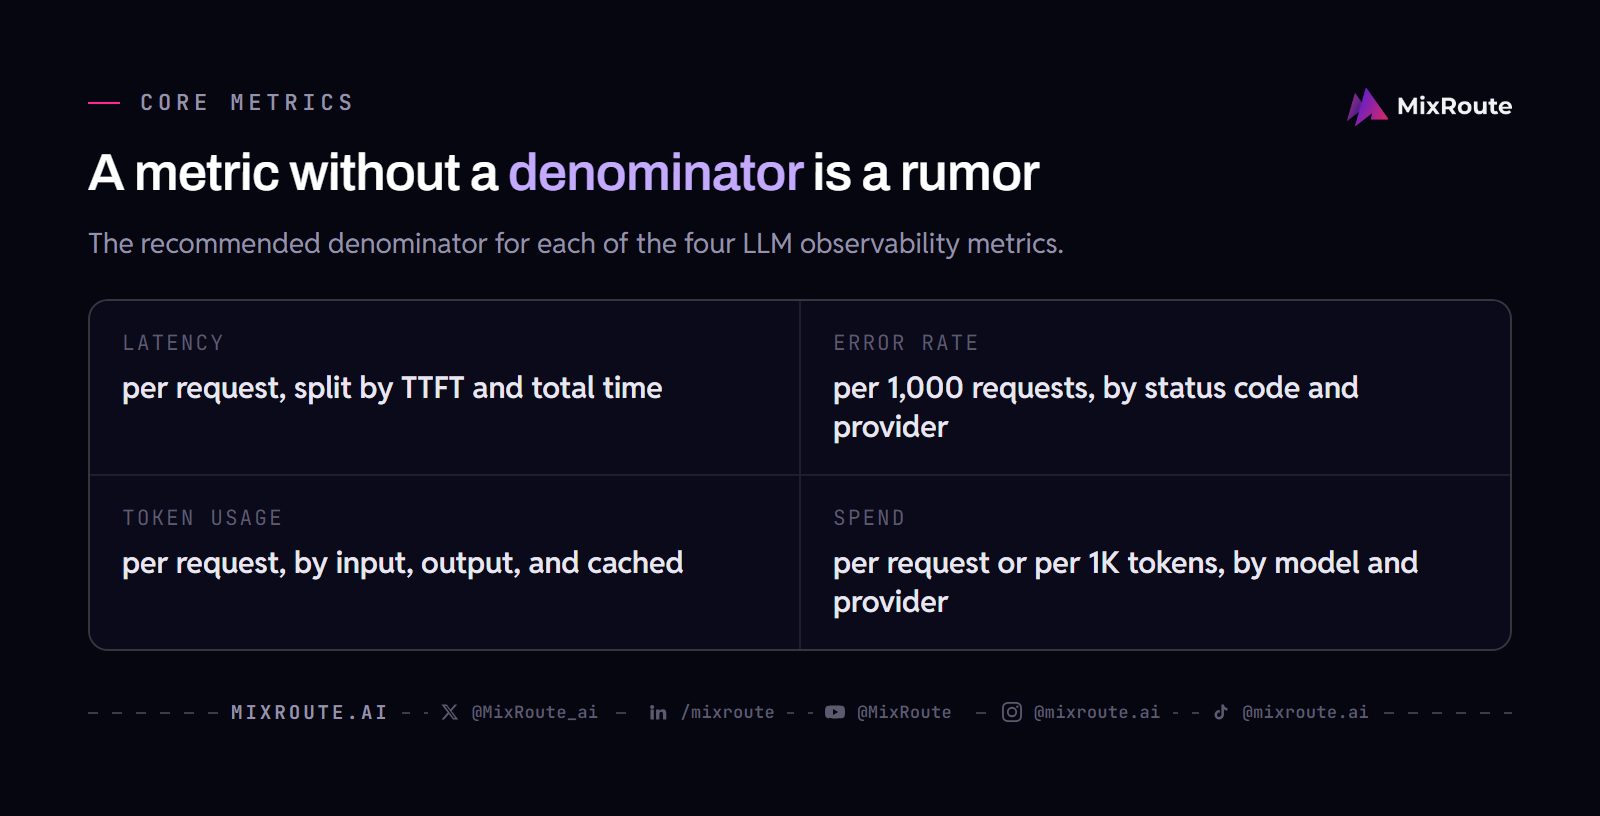
The core metrics for LLM observability are latency, error rate, token usage, and spend, and each must be measured with a clear denominator: per request, per token, per model, per provider, or per route. LLM monitoring is the systematic collection and analysis of these operational metrics in production. It focuses on the quantitative signals that indicate health and performance, while observability also includes traces and logs for deep diagnosis. Monitoring can be adopted incrementally, starting with a single integration and expanding to full tracing as needed.
These four metrics are the foundation of any dashboard. But they are only useful if you define the denominator. A latency of 2 seconds per request is different from a latency of 2 seconds per token. An error rate of 5% measured over 1,000 requests tells you more than 5% measured over 100 requests. The table below shows the recommended denominators for each metric.
| Metric | Recommended Denominator | Example Aggregation |
|---|---|---|
| Latency | Per request, split by time to first token (TTFT) and total time | p95 TTFT across all providers, p99 total time per model |
| Error rate | Per 1,000 requests, split by HTTP status code and provider | Error rate per provider, per route, per model |
| Token usage | Per request, split by input, output, and cached tokens | Average tokens per request per model, total tokens per day |
| Spend | Per request, per 1K tokens, per model, per provider | Cost per 1K tokens per provider, daily spend per route |
Latency: TTFT, total time, and percentiles
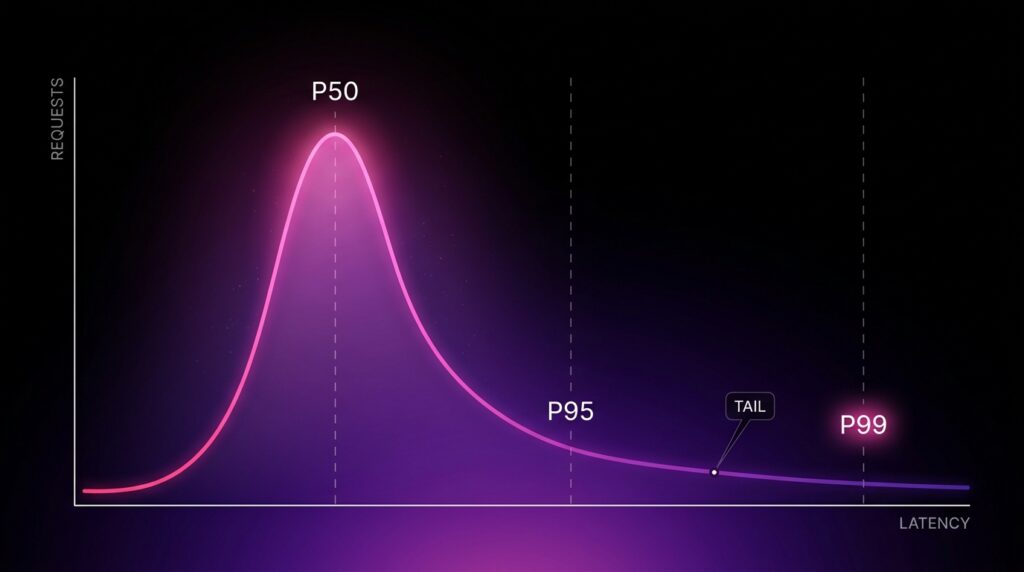
Time to first token (TTFT) measures how long the user waits before the first token arrives. Total time measures the full duration of the request, including streaming. Percentiles matter more than averages because a single slow request can skew the mean. Track p50, p95, and p99 for both TTFT and total time, per provider and per model.
Error rate: status codes, retries, and provider-specific errors
Error rate is the percentage of requests that fail. Group errors by HTTP status code (429 for rate limit, 5xx for server errors, 4xx for client errors) and by provider-specific error codes. A retry multiplier counts extra calls, but those calls are potentially billable, not automatically billable, unless you have current provider policy evidence for failed-request billing. Track retries separately from first-attempt errors.
Token usage: input, output, cached, and total
Token usage is the volume of tokens processed by the model. Split it into input tokens, output tokens, and cached tokens, because providers often price them differently. Cached tokens are a discounted subset of input tokens, so the total token count per request is input plus output. Aggregate token usage per model and per provider to compare efficiency and cost.
Spend: cost per request, per model, per provider
Spend is the cost of running your LLM calls. Measure cost per request, cost per 1K tokens, and total spend per model and per provider. If you use a gateway like MixRoute, the gateway provides billing metadata that includes token counts, latency, and cost, and MixRoute’s FAQ, checked on 2026-08-17, states that it does not store prompts or responses by default. That means you can track spend precisely without storing sensitive prompt data.
Traces: Connecting Requests Across the Stack
Distributed tracing propagates a trace ID from the application through the gateway to the provider, and each span captures the provider call, latency, token counts, and routing decision, which enables end-to-end diagnosis of where time or errors are introduced.
Metrics tell you that something is wrong. Traces tell you where. A trace is a tree of spans, where each span represents a unit of work. For an LLM request, the spans might include the application handler, the gateway routing decision, and the provider call. By correlating these spans, you can see exactly how long each step took and where the error occurred.
Trace context propagation and span attributes
For traces to work, the trace ID must propagate from the application through the gateway to the provider. This is done via HTTP headers, such as the W3C trace context. Each span should carry attributes: the model name, the provider, the route, the token counts, and the HTTP status code. These attributes are what make the trace searchable and filterable.
Correlating gateway routing decisions with provider performance
A gateway like MixRoute may send a request to a different provider when the primary one fails, and its Smart Routing feature assigns the model by request complexity and task type from the pool you authorize. The trace should capture which provider was selected and why. If a fallback provider was used, the trace should show the fallback event. This correlation is what lets you answer the question: did the gateway route to a slow provider, or did the primary provider fail?
Integrating with existing APM tools (e.g., OpenTelemetry)
OpenTelemetry is the standard for distributed tracing. It supports custom spans for LLM calls, and you can propagate trace context through the gateway. If you already use an APM tool that supports OpenTelemetry, you can send your LLM traces there and view them alongside your other services. The integration is a matter of configuring the exporter and defining the span attributes.
Trace sampling strategies for cost control
Tracing every request can be expensive, especially at high volume. Use sampling strategies to control cost. Head-based sampling decides whether to trace a request at the start, based on a probability or a rule. Tail-based sampling decides after the request completes, which lets you keep traces that had errors or high latency. For LLM workloads, consider sampling 10% of successful requests and 100% of failed requests.
Alerts: Setting Thresholds That Actually Fire
Alerts should be based on percentiles and error rates over a rolling window, with separate thresholds for provider and gateway failures, and dynamic baselines where possible.
Alert fatigue is a real problem. If you set a threshold too low, you get paged for every minor blip. If you set it too high, you miss real incidents. The key is to use percentiles over a rolling window, not raw averages, and to separate alerts by failure domain.
| Alert Type | Recommended Threshold | Window | Action |
|---|---|---|---|
| Latency (p95) | Baseline + 50% for 5 minutes | 5 minutes | Page on-call |
| Error rate | 5% per 1,000 requests for 5 minutes | 5 minutes | Page on-call |
| Spend | Daily budget exceeded by 20% | 1 day | Log and notify |
| Fallback event | Any fallback routing event | Real-time | Log and review |
These thresholds are illustrative starting points, not measured data.
Choosing the right aggregation window
The aggregation window determines how quickly an alert fires. A 1-minute window catches spikes but generates noise. A 15-minute window is calmer but delays detection. For latency and error rate, a 5-minute window is a good starting point. For spend, a daily window is appropriate because cost accumulates over time.
Thresholds for latency, error rate, and spend
Latency thresholds should be based on your historical baseline. If your p95 latency is normally 500ms, an alert at 750ms is reasonable. Error rate thresholds are often set at 5% per 1,000 requests, but this depends on your traffic volume. Spend alerts should be tied to a budget, such as alerting when daily spend exceeds 120% of the expected daily average.
Alert fatigue: when to page vs. log
Not every alert deserves a page. Page for incidents that affect users: high error rate, high latency, or complete provider failure. Log for events that are informational: a single fallback event, a minor spend increase, or a slow but successful response. The goal is to have a human respond to pages and review logs on a schedule.
Using routing fallback events as alert signals
A fallback event is when the gateway routes to a secondary provider because the primary failed. This is a useful signal because it indicates a provider issue even if the request succeeded. Alert on any fallback event, but log it rather than paging, unless the fallback rate exceeds a threshold, such as 10% of requests over 5 minutes.
Dashboard Blueprint: Denominator Definitions and Ratios
A dashboard should show metrics per provider, per model, per route, and per application, with denominators defined explicitly to prevent metric misinterpretation.
The most common observability mistake is mixing denominators. If you compare error rate per request on one panel and error rate per token on another, you will draw the wrong conclusion. The table below shows the key ratios and their denominators.
| Ratio | Numerator | Denominator | Purpose |
|---|---|---|---|
| Error rate per provider | Failed requests | Total requests per provider | Identify unhealthy providers |
| Error rate per route | Failed requests | Total requests per route | Identify routing misconfigurations |
| Error rate per model | Failed requests | Total requests per model | Identify model-specific issues |
| Cost per 1K tokens | Total cost | Tokens / 1,000 | Compare provider pricing |
| Latency per provider | Total latency | Total requests per provider | Compare provider speed |
Key ratios: error rate per provider, per route, per model
The three most important ratios are error rate per provider, per route, and per model. Error rate per provider tells you if a specific vendor is having issues. Error rate per route tells you if a specific routing rule is broken. Error rate per model tells you if a specific model is misbehaving. Each ratio uses a different denominator, so you must be explicit about which one you are viewing.
Denominator pitfalls: mixing request counts and token counts
Mixing request counts and token counts is a common pitfall. For example, if you calculate error rate as failed requests divided by total tokens, the number will be artificially low because tokens per request vary. Always use requests as the denominator for error rate and latency, and use tokens as the denominator for cost and efficiency metrics.
Dashboard panels: latency heatmaps, error rate trends, cost breakdown
A useful dashboard has three main panels. A latency heatmap shows latency distribution over time, with rows for each provider or model and columns for time buckets. An error rate trend shows the percentage of failed requests over time, split by failure domain. A cost breakdown shows spend per provider and per model, with a daily total.
Drill-down: from aggregate to individual trace
Every panel on the dashboard should be clickable. When you see a spike in error rate, you should be able to click on it and see the individual traces that contributed to the spike. This drill-down capability is what turns a dashboard from a monitoring tool into a diagnostic tool. The trace view should show the full path: application, gateway, and provider.
Open Source vs. Hosted Observability: What You Actually Get
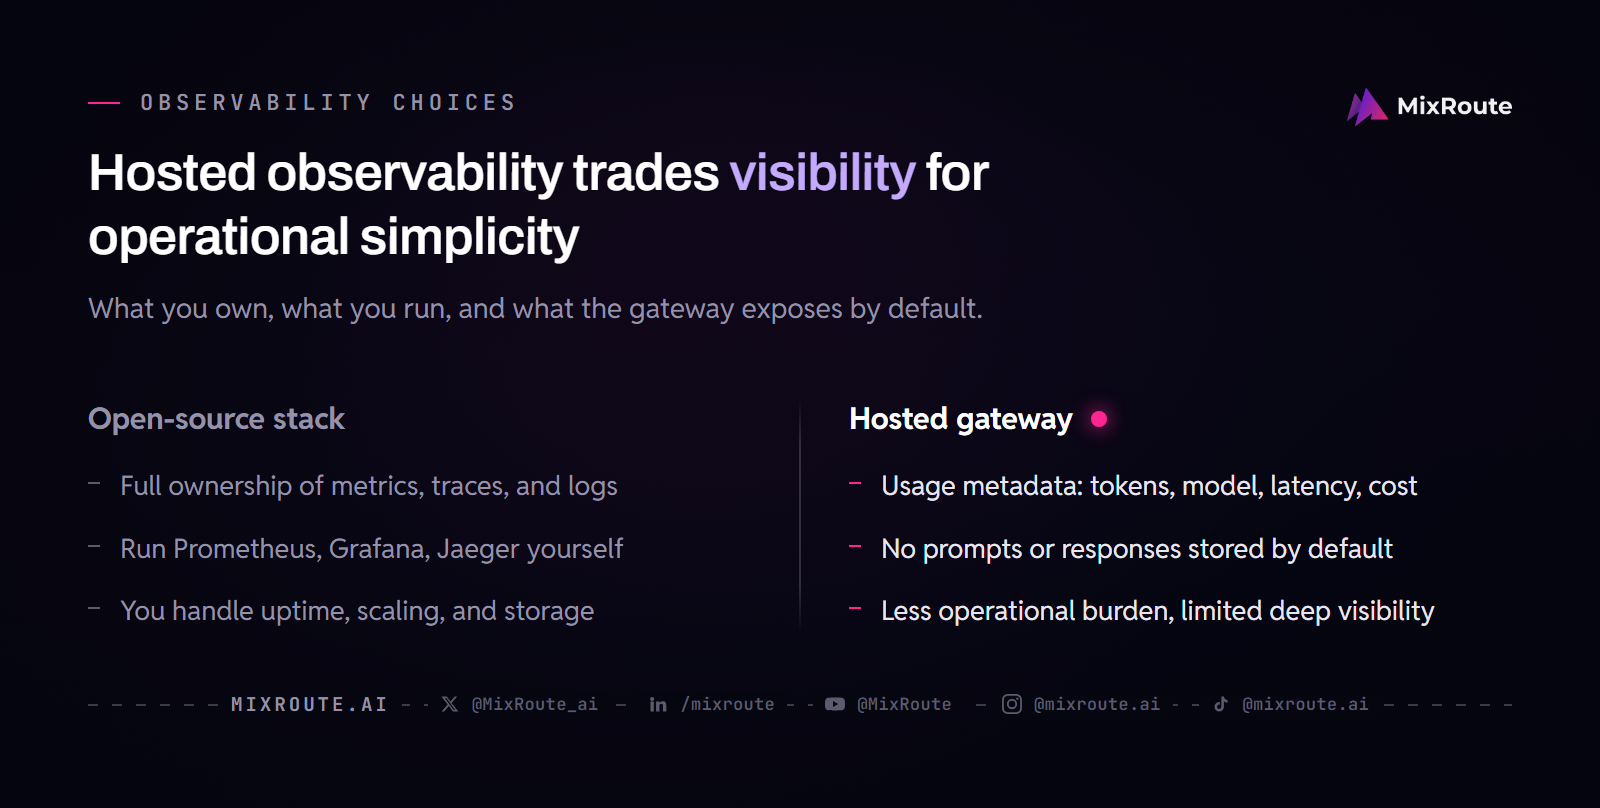
Open-source tools offer full control but require infrastructure management, while hosted gateways like MixRoute expose usage metadata but do not store prompts or responses by default.
The choice between open source and hosted observability is a trade-off between control and operational simplicity. Open-source stacks like Prometheus, Grafana, and Jaeger give you complete ownership of your data. Hosted gateways provide some observability out of the box but limit what you can see of prompts and outputs.
Open-source stack: metrics, traces, and logs
A typical open-source stack includes Prometheus for metrics, Grafana for dashboards, and Jaeger or Tempo for traces. You can also add Loki for logs. This stack is powerful and flexible, but you have to run it yourself. You are responsible for uptime, scaling, and storage. For a small team, this can be a significant operational burden.
Hosted gateway observability: what’s included and what’s not
MixRoute, as a hosted service, provides access to 250+ models through a single endpoint. The data it retains is usage metadata: token counts, model, latency, and cost. Its FAQ describes that metadata as feeding billing and a usage dashboard, and states that it does not store prompts or responses by default. That means that by default you cannot inspect prompts or outputs through the gateway. This is a privacy feature, but it limits deep debugging.
APM extension: integrating with existing monitoring
If you already use an APM tool, you can extend it to cover LLM calls. Use OpenTelemetry to send traces from your application to your APM. The gateway should propagate trace context so that the provider call appears as a span in your existing trace. This approach gives you the full picture without switching tools.
Cost and maintenance trade-offs
Open-source observability has no license fees, but it has infrastructure costs: compute for the collectors, storage for the data, and time for maintenance. Hosted observability has a simpler operational profile, but you are limited by what the vendor provides. MixRoute, for example, charges no platform fee on top-ups, but Smart Routing charges 5% of the cost of each request that passes through it after a free period. This is an optional feature fee, not a token markup.
Agentic Observability and Feedback Loops
Agentic workflows span multiple LLM calls and tool use, so observability must capture step-level traces, tool invocations, and intermediate outputs, and feedback loops use that data to refine prompts and routing rules.
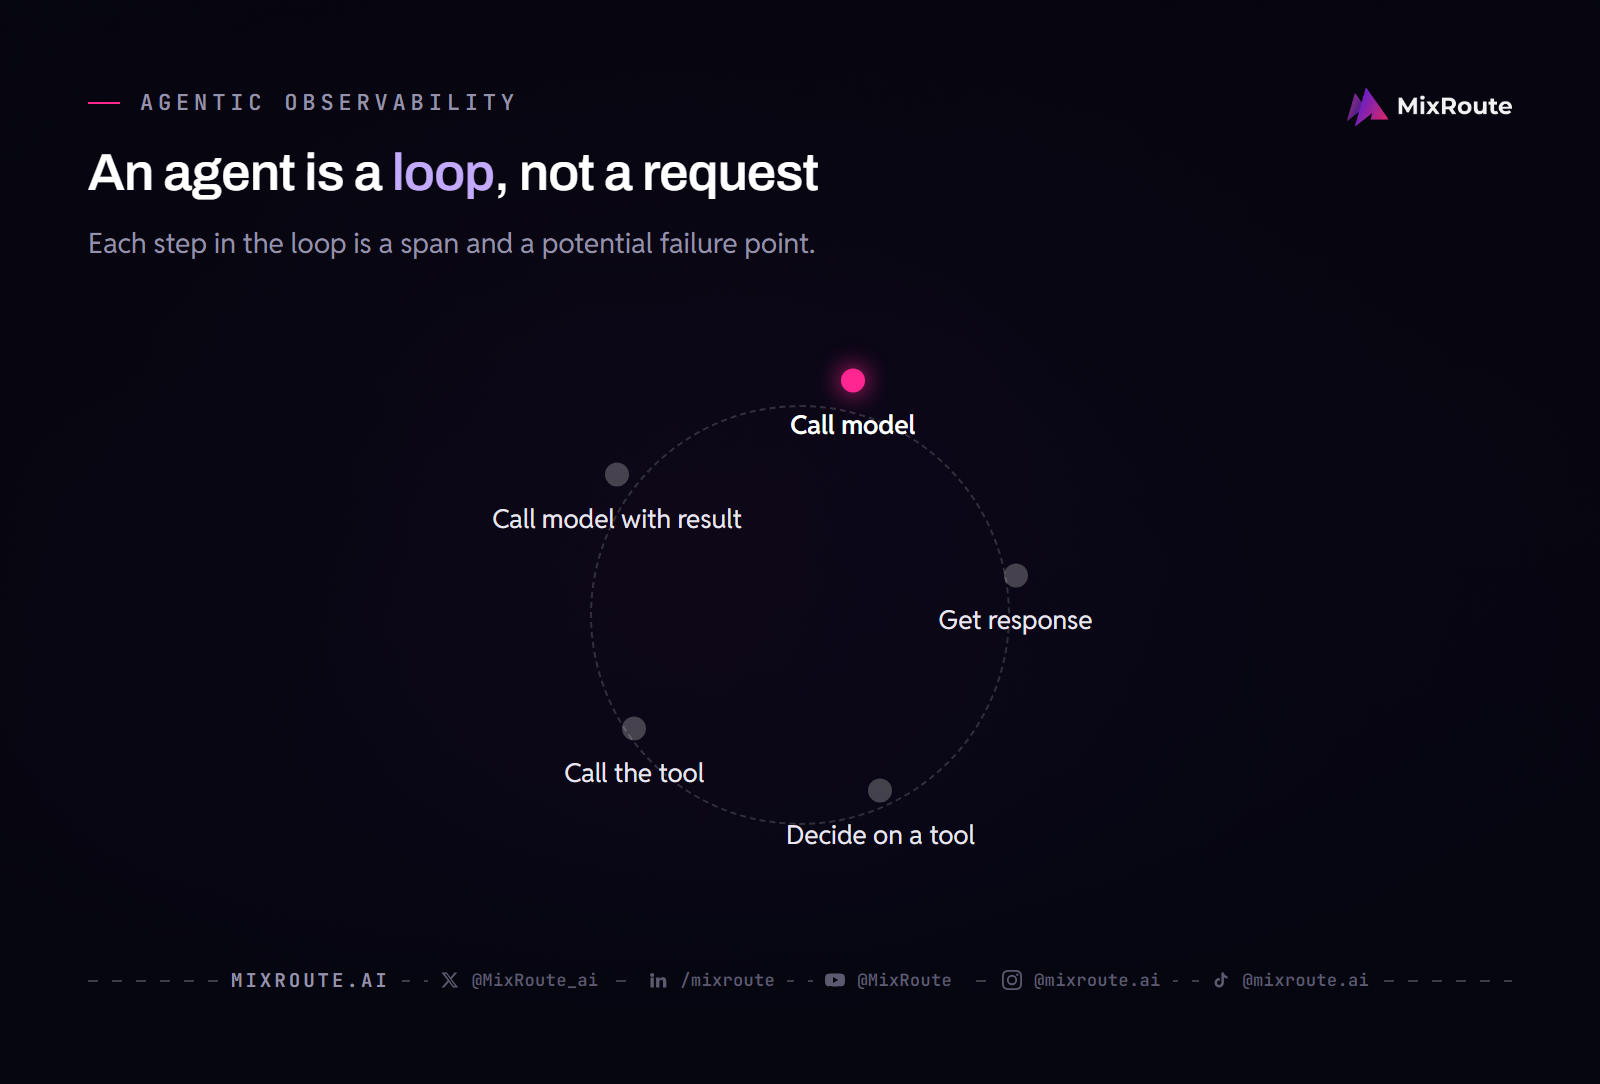
An agent is not a single LLM call. It is a loop: the agent calls a model, gets a response, decides to use a tool, calls the tool, and then calls the model again with the tool result. Each step is a potential failure point. Observability for agents must track the entire loop, not just the individual calls.
Tracing multi-step agents and tool calls
Each step in an agent loop should be a separate span. The trace should show the sequence of model calls and tool calls, with the input and output of each step. This is more complex than tracing a single request, but it is necessary to diagnose issues like a stuck loop or a redundant step. Use span attributes to record the tool name, the input, and the output.
Monitoring agent loops for stuck or redundant steps
An agent can get stuck in a loop, repeating the same tool call without making progress. Or it can make redundant calls, such as calling the same model twice with the same input. Observability should detect these patterns. Track the number of steps per agent run, the time per step, and the number of repeated tool calls. Alert if an agent exceeds a maximum step count.
Feedback loops: using metrics to tune routing and prompts
Observability data is not just for debugging; it is also for improvement. If you see that a particular provider has a high error rate, you can adjust your routing rules to favor a different provider. If you see that a model produces poor outputs for a certain prompt pattern, you can refine the prompt. These are feedback loops: the data from production informs changes to the system.
Evaluating agent performance with observability data
To evaluate an agent, you need more than latency and error rate. You need to measure task completion, which requires comparing the final output to the expected result. This is often done with a separate evaluation pipeline that uses the observability data as input. For example, you can sample traces of successful and failed agent runs and manually review them to identify patterns.
Frequently Asked Questions
FAQ
What is the difference between provider and gateway failure in LLM API observability?
Provider failures originate from the model vendor, such as an outage or rate limit, while gateway failures are internal to the routing layer, such as a misconfiguration or failover logic error. Observability must separate these to assign blame correctly, and traces are the tool that shows which layer failed.
How do you measure token usage across multiple providers?
Token usage should be captured per request, per model, and per provider, distinguishing input, output, and cached tokens. Use consistent units, such as tokens per request, and aggregate by provider to compare costs. A gateway that provides billing metadata, like MixRoute, includes token counts and cost per request.
What is a good alert threshold for LLM API latency?
Set alerts on p95 latency over a 5-minute window, with a baseline derived from historical data. Thresholds vary by model and provider, so use dynamic baselines where possible. A threshold of baseline plus 50% is a reasonable starting point for most workloads.
Can I use OpenTelemetry to trace LLM API calls?
Yes, OpenTelemetry supports custom spans for LLM calls. You can propagate trace context through the gateway and capture provider-specific attributes like model name, token counts, and latency. This integrates with existing APM tools that support OpenTelemetry.
What does 'zero data retention' mean for observability?
Some gateways retain only usage metadata: token counts, model, latency, and cost. MixRoute’s FAQ, checked on 2026-08-17, states that it does not store prompts or responses by default. This limits deep debugging of prompts and outputs but preserves privacy and reduces compliance burden. Check the documentation for the specific retention policy.
How do I distinguish model quality issues from application bugs?
Compare outputs your application records across similar inputs. If the model consistently fails on specific input patterns, it is a model issue. If failures correlate with application code changes, it is an app bug. Sampling outputs for review is necessary because the gateway does not store prompts or responses by default.
What is agentic observability?
Agentic observability tracks multi-step LLM workflows, including tool calls, intermediate outputs, and decision points. It requires step-level tracing and monitoring of agent loops for stuck or redundant steps. This goes beyond single-request metrics.
How can I use observability to improve my routing strategy?
By analyzing latency, error rates, and cost per provider, you can adjust routing rules to favor better-performing providers. Feedback loops can automate this tuning, but the initial step is to build a dashboard that shows these metrics per provider and per route.
To decide whether a hosted gateway covers what you need to measure, compare what each top-up tier includes against the signals in this article. For deeper guidance on specific metrics, see our LLM API latency guide and our guide on handling LLM API failures. If you are concerned about cost, our article on reducing LLM API costs covers spend optimization. For a custom observability setup, talk to sales to discuss your requirements. Check the documentation for your gateway to confirm what metadata is retained and what is not.