The Complete Guide to LLM API Latency (2026)
Май 23, 2026 · 9 мин. чтения
LLM API latency is the part of your AI product users feel before they read a single word of output. It is also the metric teams understand the least. Most teams can quote their model’s benchmark score and have no idea what their p99 time to first token is in production.
This guide covers what LLM API latency actually is, what causes it, how to measure it correctly, and how to reduce it. It is written for engineers shipping AI products, not for a benchmark leaderboard.
What is LLM API latency?
LLM API latency is the total time between sending a request to a language model API and receiving the complete response. It breaks into two parts: time to first token (TTFT), the wait before the first piece of output appears, and time per output token (TPOT), the speed of generation after that. Users feel TTFT as the spinner and TPOT as the typing speed.
That direct answer covers the headline. The rest of this guide is the part that actually matters in production.
The latency metrics that matter
There are four numbers worth tracking. Most teams track none of them properly.
Time to first token (TTFT). The delay between your request and the first output token. This is the spinner. It includes network round trip, queuing at the provider, prompt processing, and model load. For most products this is the single most important latency metric, because it is the wait the user consciously experiences.
Time per output token (TPOT). Also called inter-token latency. How fast tokens stream once generation starts. Multiply by output length and you get generation time. A model with fast TTFT but slow TPOT feels responsive then sluggish.
Total latency. TTFT plus generation time. The full request. This is what matters for non-streaming use cases like classification or extraction, where the user sees nothing until the whole response lands.
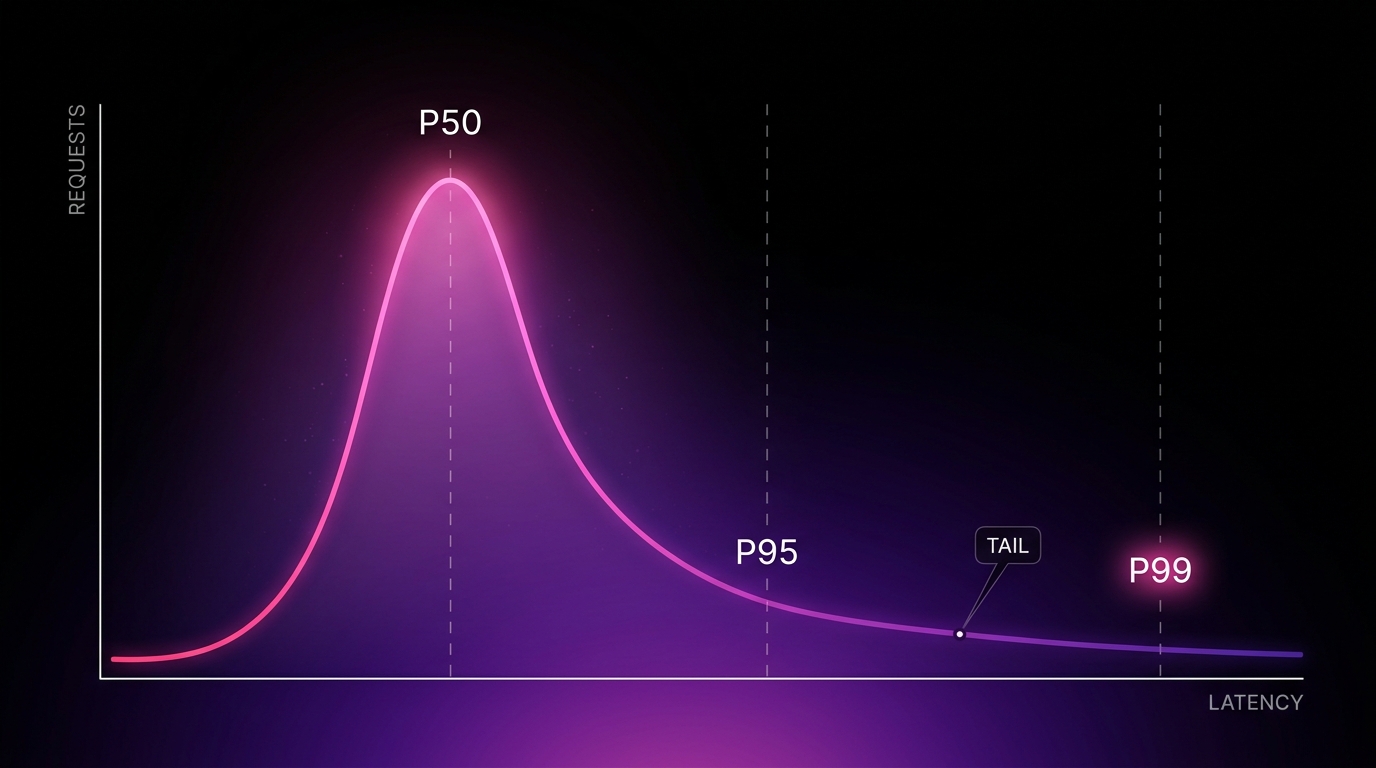
Percentile latency, not average. This is the one teams get wrong. p50 is the median request. p95 and p99 are the slow tail. Your average can look healthy while 1 in 20 users waits five times longer. Users do not experience your average. They experience their own request.
What actually causes LLM latency
Latency is not a fixed property of a model. It moves with conditions. The main drivers:
Prompt length. The model has to process every input token before it produces the first output token. A 50,000 token prompt has a longer TTFT than a 500 token prompt on the same model. Long context is not free, and the cost is paid in latency before the user sees anything.
Output length. Generation time is roughly linear in output tokens. A request that returns 2,000 tokens takes far longer than one returning 50, even at identical TPOT.
Model size. Larger models generally have higher TTFT and lower TPOT. A frontier model is slower to start and slower per token than a small one. Using a frontier model for a task a small model handles is a latency cost as well as a price cost.
Provider load. The same model on the same provider is slower under heavy traffic. Latency you measured on a quiet afternoon is not the latency your users get the week you launch and traffic spikes.
Cold starts. The first request after an idle period pays for model load, cache misses, and connection setup. Cold TTFT can be several times warm TTFT. Benchmarks run warm. First real users run cold.
Network and region. Physical distance between your service and the provider’s region adds round-trip time. A request crossing continents carries a latency floor you cannot prompt your way out of.
Queuing and rate limits. Under load, providers queue requests. A queued request has not failed and has not started. It is just waiting, and that wait is invisible in most client-side timing.
The mistake almost every team makes
Teams benchmark latency once, warm, with a short prompt, on a quiet provider, and ship that number.
Production is none of those things. Production is a cold path, variable prompt length, a provider under real load, and a long tail that the dashboard averages away.
The result is a number that is technically true and practically useless. The benchmark says 800 milliseconds. The first user of the day waits six seconds. Both are real. Only one of them is the user’s experience.
If you measure only the average, you are optimizing the request nobody’s first impression uses.
How to measure LLM latency correctly
A short checklist that separates real latency monitoring from vanity metrics.
| Practice | Why it matters |
|---|---|
| Track TTFT and total latency separately | They have different causes and different fixes |
| Report p95 and p99, not just average | The tail is what loses users and the average hides it |
| Bucket by prompt size | Latency on a 500 token prompt and a 50K prompt are different products |
| Measure cold vs warm separately | The first request of the day is the one new users meet |
| Measure server side and client side | Network and queuing only show up in one of them |
| Alert on percentile regression, not mean | A mean that holds while p99 doubles is a silent outage |
How to reduce LLM API latency
Ordered roughly by effort to impact ratio.
Stream the response. Streaming does not make the request faster. It changes when the user sees output, which changes the perceived latency dramatically. For chat and generation use cases, streaming is the highest leverage change you can make. It does not help non-streaming use cases like classification, where the user waits for the whole response regardless.
Cut the prompt. Every input token adds to TTFT. Trim system prompts, drop unused context, and stop sending the entire conversation history when a summary would do. This lowers both latency and cost at the same time.
Right-size the model. A task that runs on a small model does not need a frontier one. Smaller models have faster TTFT and faster TPOT. Routing easy tasks to small models cuts latency on the requests that never needed the big model.
Cap output length. Set max tokens to what the task actually needs. A classification task that can answer in one token should not be allowed to generate two thousand.
Use prompt caching. Providers cache identical prompt prefixes. A cache hit skips reprocessing the cached portion, which lowers TTFT significantly on repeated structures. Structure messages so the static content sits at the front.
Stay warm. Cold starts are a latency tax paid by your newest users. Keeping a path warm, or routing cold requests to a provider you are already hitting, removes the spike entirely.
Route to the fastest healthy provider. The same model is served by multiple providers at different latencies, and the fastest one changes with load. Static provider choice means you eat whatever latency that one provider has at that moment. Live routing sends each request to whichever endpoint is actually fast right now.
Where MixRoute fits
The last two fixes, staying warm and routing to the fastest healthy provider, are infrastructure problems, not prompt problems. They are also the ones most teams never solve, because solving them means building and maintaining a routing layer.
MixRoute is that layer. One OpenAI-compatible API that measures provider latency in real time and routes each request to the fastest healthy endpoint. It stays warm across providers, so a cold request goes to one that is already hot. When a provider degrades, traffic moves before your users feel it. The model you call stays the same. The latency under it gets handled.
This is the difference between latency being a number you benchmarked and latency being a system you run.
Frequently asked questions
What is a good TTFT for an LLM API? It depends on the model and use case, but for interactive products a TTFT under one second feels responsive and over three seconds feels broken. Frontier models on long prompts often exceed this, which is why streaming and routing matter.
What is the difference between latency and throughput? Latency is how long one request takes. Throughput is how many requests you can serve per unit time. A system can have low latency and low throughput, or high throughput and high tail latency. They are different problems with different fixes.
Does a bigger context window increase latency? Yes. The model processes every input token before producing the first output token, so a larger prompt increases time to first token. Using a large context window means accepting higher latency on those requests.
Why is my LLM API slower in production than in testing? Testing is usually warm, short-prompt, and on an idle provider. Production is cold starts, variable prompt length, and a provider under real load. The benchmark measured the best case. Production runs the average and the tail.
Does streaming reduce latency? Streaming does not reduce total latency. It reduces perceived latency by showing output as it generates instead of after it completes. For interactive use cases the perceived improvement is large. For non-streaming tasks it does nothing.
How do I reduce p99 latency specifically? p99 is usually driven by cold starts, provider load spikes, and queuing, not by your prompt. The fixes are staying warm, capping retries, and routing away from degraded providers in real time, rather than optimizing the median request.
The bottom line
LLM API latency is not one number. It is TTFT and TPOT, measured at the tail, bucketed by prompt size, separated cold from warm. The teams that ship fast AI products are not the ones who picked the fastest model on a benchmark. They are the ones who measure the request their users actually make and route around the conditions that slow it down.
MixRoute handles the routing and warm-path part automatically. One API, every model, each request sent to the fastest healthy provider in real time. See how MixRoute handles latency